Monthly Market Recap – May 2023
When the Stock Market is a market of stocks
May was a mixed month for stocks as the NASDAQ surged, the S&P remained about flat, and the Dow Jones Industrial Average took a hit. The NASDAQ advanced 5.9% in May largely thanks to stellar gains in the semiconductor space, notably by NVIDIA (NVDA), Advanced Micro Devices (AMD), and Broadcom (AVGO). The S&P 500 rose 0.4%, while the Dow Jones Industrial Average lost 3.2%. It was a down month around the world — Emerging Markets slipped 1.7% and Developed Markets sank 4.1%.
*10
*1
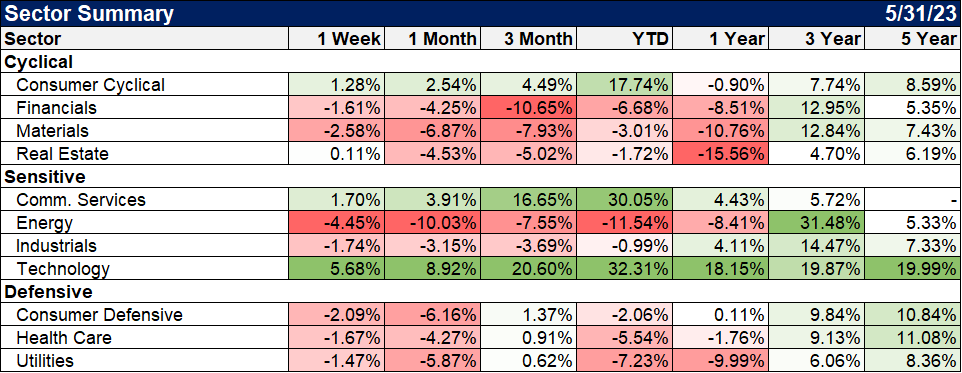
Only 3 of the 11 US stock sectors were positive in May, as Technology, Communication Services, and Consumer Discretionary led the way. On the flip side, Energy tumbled 10%, followed by Materials (down 6.9%) and Consumer Staples (down 6.2%).
*2
What has contributed to the market gains?
Clearly, Mega-Cap Tech Stocks led the markets higher, especially companies in semiconductors and artificial intelligence.
As of June 5th, the S&P 500 is up 443.55 points or (+11.53%) year-to-date. The chart below shows that just 7 stocks accounted for over 412 points of this gain, indicated by their individual contributions to the index’s gain in the upper right of each box:
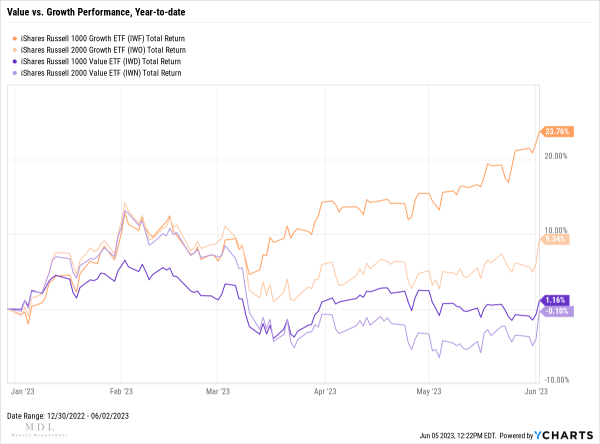
The divergence in the stock market is further illustrated by the performance of Value vs. Growth and Large-Cap companies vs Small-Cap companies:
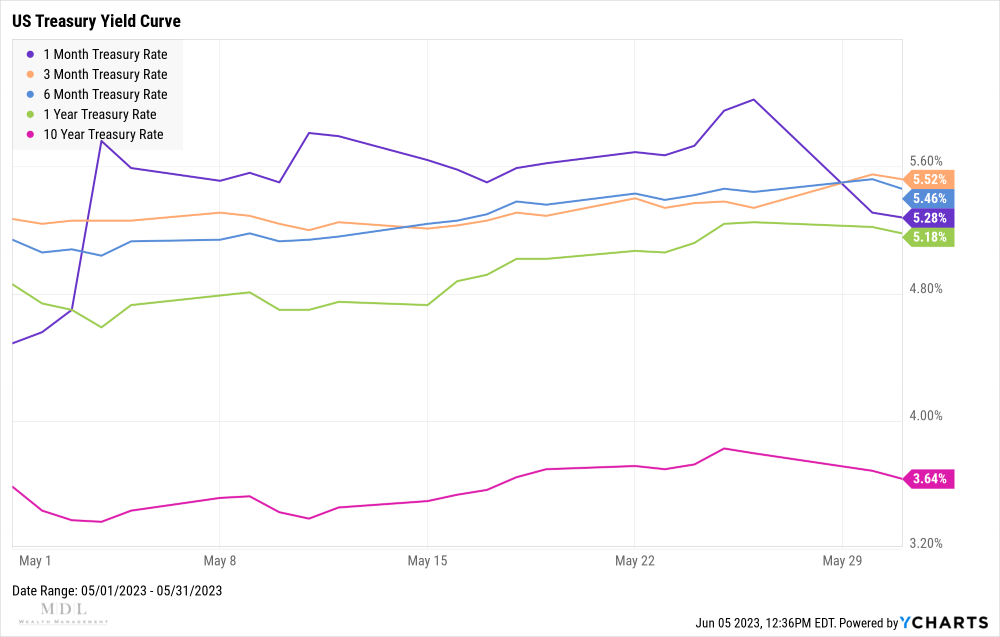
The fixed income markets saw US Treasury yields spike sharply in May amid debt ceiling risk. The 1-Month Treasury Bill surged a whopping 93 basis points to 5.28%, followed by the 3-Month at 5.52% (+42 bps) and 6-Month at 5.46% (+40 bps). Long-term bonds, such as the 10-Year, also got a lift, but its yield of 3.64% still puts it as the lowest on the curve. Yields moved slightly down to end the month, as it became clearer that a debt ceiling agreement had been reached. The yield curve remained inverted, which is a widely accepted indicator of a recession on the horizon.
Economic Data points to a continued slowdown
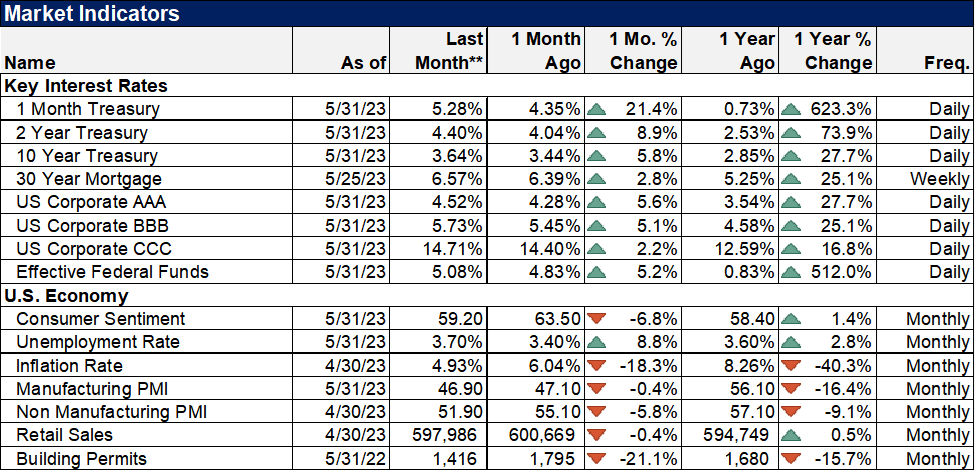
US Inflation was virtually unchanged in April at 4.93%, as was US Core Inflation at 5.52%. Both inflation readings came in less than one-tenth of a percent lower than the previous month. The US Consumer Price Index rose 0.37% in April, and US Personal Spending increased 0.84%. The price of gold spent the first half of May above $2,000 but ended the month at $1,962.77, down slightly month-over-month. Oil prices took a breather: the price of WTI per barrel dipped 6.5% to $71.81 and Brent sank 6.8% to $75.77. Both types of crude oil are down over 41% from their highs set in March of 2022. May’s decline in oil prices translated into three cents off the average price of regular gas, to $3.78 per gallon at the end of May.
U.S. manufacturing declined for a seventh straight month in May, with weakness in new orders. That being said, factories boosted employment to a nine-month high. The Institute for Supply Management (ISM) reported that its manufacturing PMI fell to 46.9 last month from 47.1 in April. It was the seventh straight month that the PMI is below the 50-employee threshold, indicating contraction in manufacturing, and is the longest such stretch since the Great Recession.
The US labor market continues to surprise. Data from Bureau of Labor Statistics out on Friday showed there were 339,000 jobs created in May, topping Wall Street estimates for 195,000. This marked the 14th straight month that job creation came in above what Wall Street economists had expected and the largest monthly increase since January. Following this report, many Wall Street economists suggested the uptick in the unemployment rate to 3.7% and the deceleration in hourly wages—which rose 4.3% over last year compared to 4.4% in April—as signs that the Federal Reserve is beginning to see the "better balance" Federal Reserve chair Jerome Powell has frequently referenced.
Housing - US New Single-Family Home Sales were up 4.1% in April, though US Existing Home Sales slipped 3.4%. Despite the decline in existing home sales, the Median Sales Price of Existing Homes rose by 3.6% to $388,800. Mortgage rates were also on the rise in May: 15-Year and 30-Year Mortgage Rates ended the month at 5.97% and 6.57%, respectively.
*3, 4, 5, 6, 7, 8, 9
What does this mean for the next move from the Federal Reserve?
The Federal Reserve may be applauding the signs of a slowing economy, as they have been attempting to accomplish this since their first interest rate hike 14 months ago on March 16, 2022. The Federal Reserve hiked the Target Federal Funds Rate by 25 bps at its May 3rd FOMC meeting, bringing it to 5.25%. The Fed Funds rate has now been hiked 500 basis points since they began the war against inflation.
Still, inflation remains well above their 2% target and is not coming down as quickly as they would like. In addition, the labor market remains tight. So, we are left scratching our heads as to what they will do at their next policy meeting on June 14th, just as the chairman himself may be doing.
The argument to raise interest rates further:
1) Inflation is slow to come down to the Federal Reserve Target
2) The labor market remains stubbornly strong
3) Consumers have proven to be resilient in spending
The argument to pause:
1) There is a significant lag time for rate hikes to impact the economy
2) The economy is showing signs of slowing
3) May cause additional stress on the banking system
4) The U.S. Treasury is set to issue approximately $1 trillion of new debt in the coming weeks.
It is clearly a difficult decision. There are a growing number of CEOs expressing increasingly cautionary commentary of what lies ahead, and they are managing their businesses accordingly through layoffs and other cost-cutting measures. These preemptive measures could cause a recession to be a self-fulfilling prophecy. The Federal Reserve has stated that a possible recession in and of itself is not a deterrent from raising rates further, but there is a growing expectation that they will skip the rate hike in June and leave the door open for additional hikes as early as July.
For more great insights, highlights, and financial education,
follow MDL Wealth Management on:
Content in this material is for general information only and not intended to provide specific advice or recommendations for any individual. All performance referenced is historical and is no guarantee of future results. All indices are unmanaged and may not be invested into directly.
Companies mentioned are for informational purposes only. It should not be considered a solicitation for the purchase or sale of the securities. Investing involves risks, and investment decisions should be based on your own goals, time horizon, and tolerance for risk.
The economic forecasts set forth in this material may not develop as predicted, and there can be no guarantee that strategies promoted will be successful.
3Department of the Treasury
4Bank of America Merrill Lynch
5Federal Reserve
6University of Michigan
7Bureau of Labor Statistics
8Institute for Supply Management
9Census Bureau


